An evidence-based public resource on ocean energy

Blue Energy in India: the ocean’s renewable power, mapped and assessed.

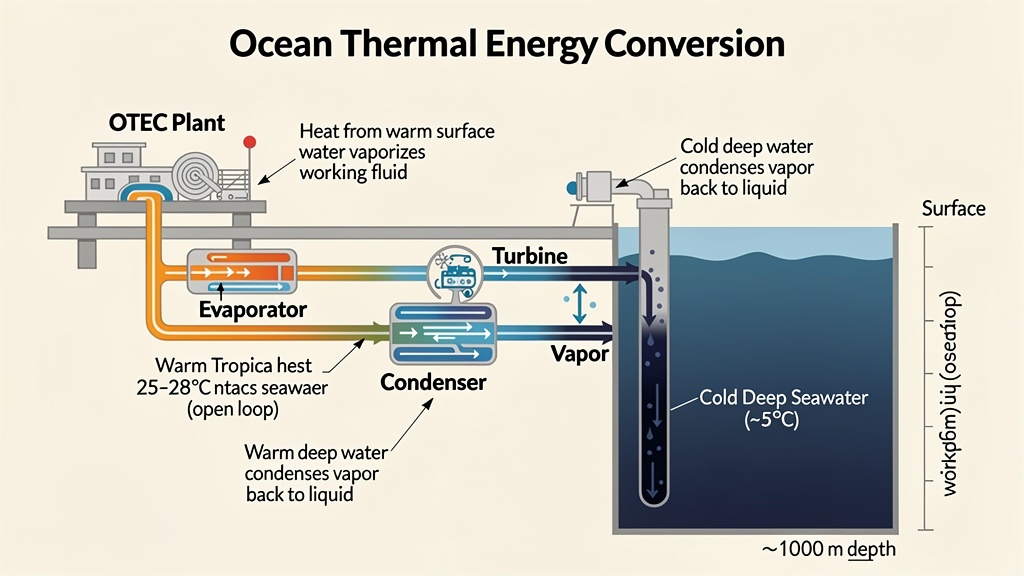
India’s Exclusive Economic Zone holds an estimated 9.2 lakh TWh of integrated marine renewable energy — a number that is so large it can mislead, so this site separates resource potential from techno-economic potential and from deployed capacity. Wave, tidal, ocean currents, OTEC, salinity-gradient, offshore wind and floating solar are explained in plain English with Indian data, technology status, project pipelines, and policy context.

Source: Indian National Centre for Ocean Information Services (INCOIS), 2024 Integrated Ocean Energy Atlas. This site is informational and not affiliated with INCOIS, NIOT, MoES or MNRE.

Start here

What you’ll find on BlueEnergy.in

Most online “blue energy” content blends four very different things: ocean renewables, fossil-derived blue hydrogen, generic “blue economy” policy and the Blue Energy Motors truck brand. In India’s recent official communications, “blue energy” overwhelmingly refers to the suite of marine and offshore renewables mapped by INCOIS: offshore solar and wind, wave, tidal, ocean current, OTEC and salinity-gradient power. We focus there and clearly distinguish the other terms where they appear.

Marine and offshore renewables are sometimes called blue renewable energy, ocean energy or marine renewable energy. The Indian government’s draft framework on ocean energy — see policy & institutions — is consistent with this usage.

How to use this site

This is a static, no-tracking, plain-vanilla website. No data is collected about you, and the only cookie used is one that remembers your cookie preference. We don’t load any third-party analytics, advertising or scripts.
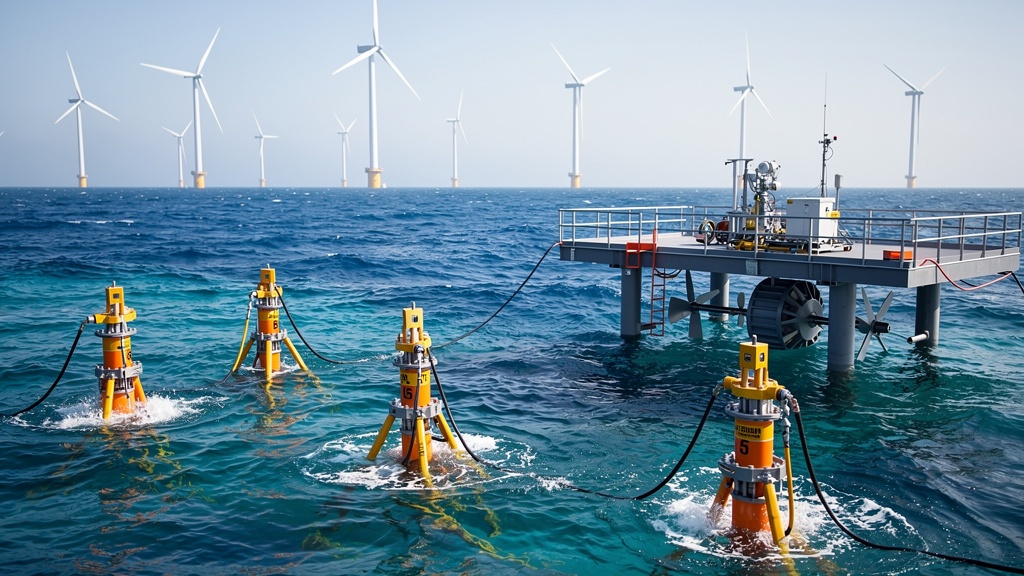
A calm blue surface with several ocean energy devices — point-absorber wave buoys, a small tidal turbine platform, and offshore wind turbines in the background.

The seven forms of “blue energy”

Wave, tidal (barrage & stream), ocean currents, OTEC, salinity-gradient (osmotic), offshore wind, and floating offshore solar — each with its own page.

Wave Tidal OTEC Salt gradient Offshore wind Floating PV Currents Hybrid
How to read every ocean energy number on this site. Every statistic — including the 9.2 lakh TWh headline — is presented at four levels: resource potential (the gross energy physically present in a sea cell), extractable potential (what a real device can capture at realistic efficiency), techno-economic potential (what is plausibly deployable at plausible cost with grid access) and project feasibility (what survives site-specific engineering, environmental and social screening). The largest number is always the resource potential and is almost never what gets built. For any deployment-relevant figure, look at the techno-economic line.
Headline numbers, in context

9.2 lakh TWh — what does that actually mean?

INCOIS’s 2024 Integrated Ocean Energy Atlas estimates India’s combined theoretical resource across wave, tidal, OTEC, currents and offshore wind at roughly 9.2 lakh TWh (~920,000 TWh) per year within the EEZ. India’s own current annual electricity consumption is around 1.6–1.8 lakh TWh — so the theoretical ocean resource is several times larger than present demand. But that figure is a resource envelope, not an engineering target.

~9.2 lakh TWh
INCOIS Integrated Ocean Energy Atlas, theoretical potential in India’s EEZ
Source: INCOIS, 2024
~1.6 lakh TWh
India total annual electricity generation — for scale, not a target
Source: Central Electricity Authority
~7,500 km
Length of India’s mainland coastline, plus island chains — the resource’s geographical expanse
Source: MoES
2.02 million km²
Area of India’s Exclusive Economic Zone where ocean energy is inventoried
Source: MoEFCC
Why the “9.2 lakh TWh” headline can mislead. Resource potential is calculated from the gross kinetic or thermal energy physically present in the ocean grid cell — it is the size of the resource before you ask whether a device can intercept it, survive storm conditions, deliver power to shore, compete on cost, or be permitted alongside fisheries and navigation. The Integrated Ocean Energy Atlas deliberately reports resource potential alongside extractable / techno-economic potential — always read both. We do the same throughout this site.
Map teaser

Where the resource is concentrated

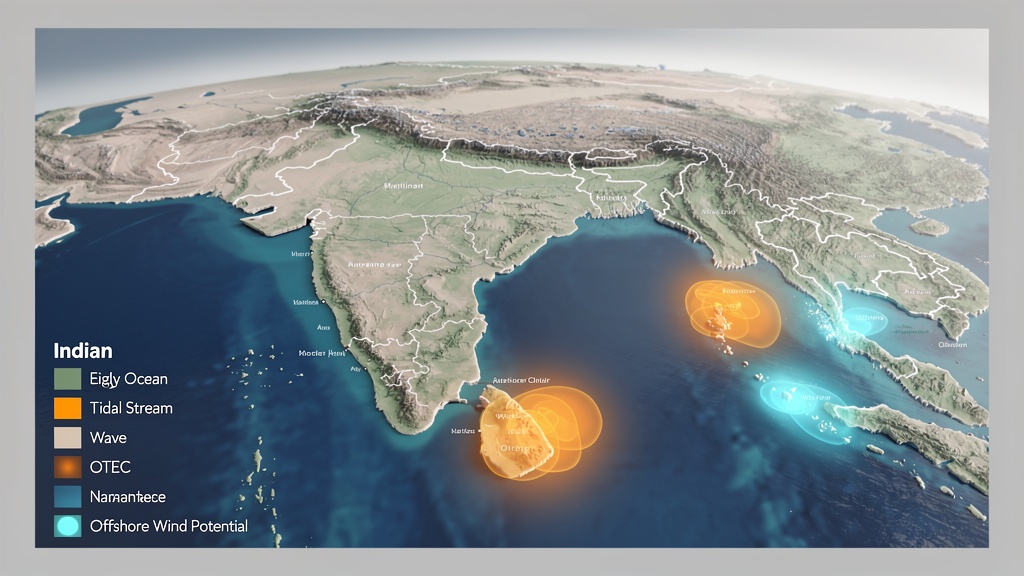
Different coasts and water bodies hold different forms of “blue energy.” Gulf of Khambhat in Gujarat and the Sundarbans in West Bengal show strong tidal signatures; the south-west coast and parts of the east coast show strong wave resources; Lakshadweep and the Andaman & Nicobar Islands offer large thermal gradients favouring OTEC; salinity-gradient opportunities exist where major rivers meet the sea (parts of Andhra Pradesh, West Bengal). The figure below is illustrative — for the authoritative 5 km resolution grid, see India’s potential.

Stylised map showing India surrounded by the blue Indian Ocean with glowing energy-resource hotspots along the coasts and at island chains.
Indicative national overview: tidal, wave, OTEC and offshore wind zones.
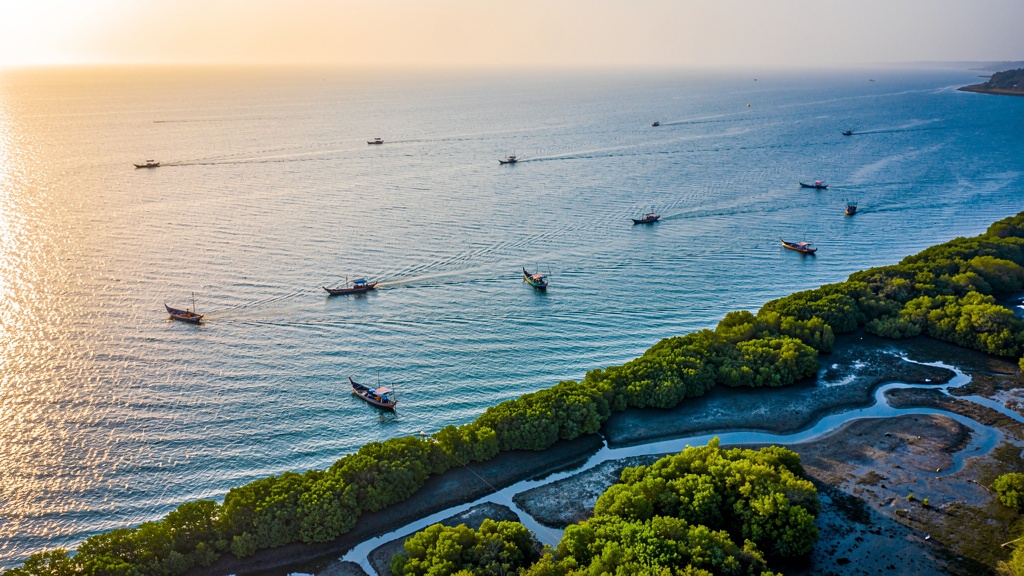
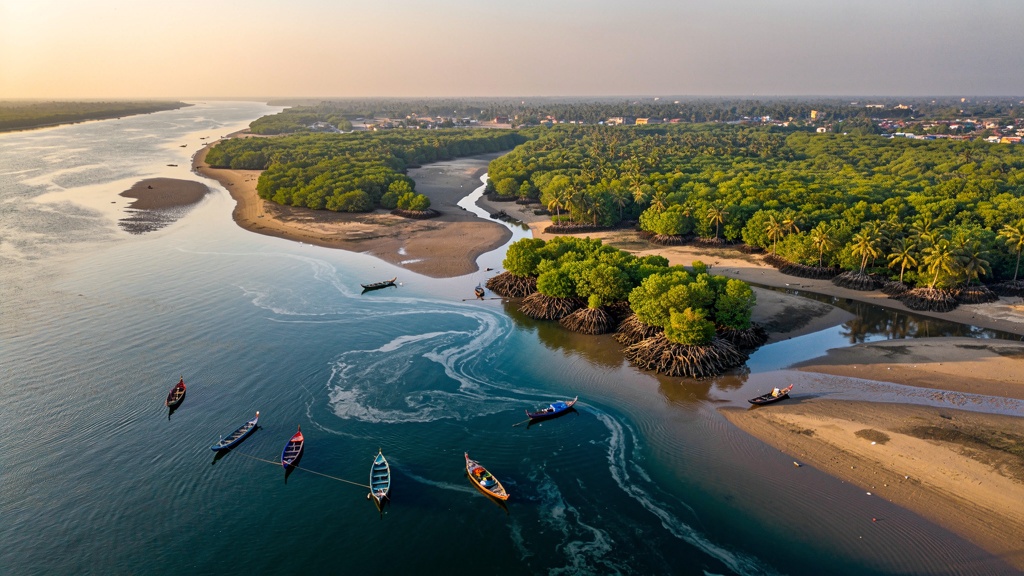
Aerial view of Gujarat’s Gulf of Khambhat at low tide, showing wide tidal flats.
Gujarat’s Gulf of Khambhat — India’s highest-studied tidal resource area.
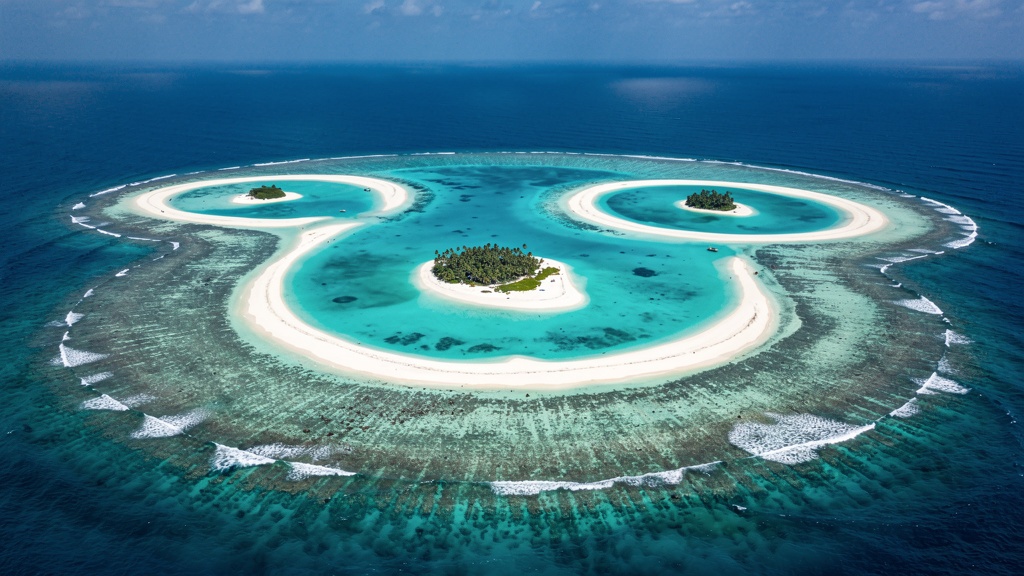
Aerial photograph of turquoise lagoons and coral islands in India’s Lakshadweep archipelago.
Lakshadweep — tropical temperature gradients enable OTEC and desalination.
Reading the resource

How the atlas was made, and why the grid matters

The INCOIS Integrated Ocean Energy Atlas is built on 5 km resolution modelling of long-term wave, wind, tidal and thermal datasets — guided by the WaveWatch III, WRF and HYCOM families of global ocean models and validated against moored instrumentation and satellite observations. Each grid cell reports mean annual resource, an intra-annual (monthly) profile, and extreme-condition indications useful for device design.

From a 5 km grid to a project

  1. Resource potential at the 5 km grid cell, taking only the gross energy present — wave power flux, tidal stream speed squared, thermal gradient, salinity gradient.
  2. Extractable potential, taking only the fraction a real device could capture under realistic capacity factors and device efficiencies.
  3. Techno-economic potential, after applying realistic assumptions about capex, transmission distance, grid availability, and device survival.
  4. Project-level feasibility, requiring detailed site studies — bathymetry, metocean, geotechnical, environmental, social — beyond the atlas.

The same four-step ladder applies to most offshore renewables — when reading foreign atlases (UK, US, IEA) the order is identical.

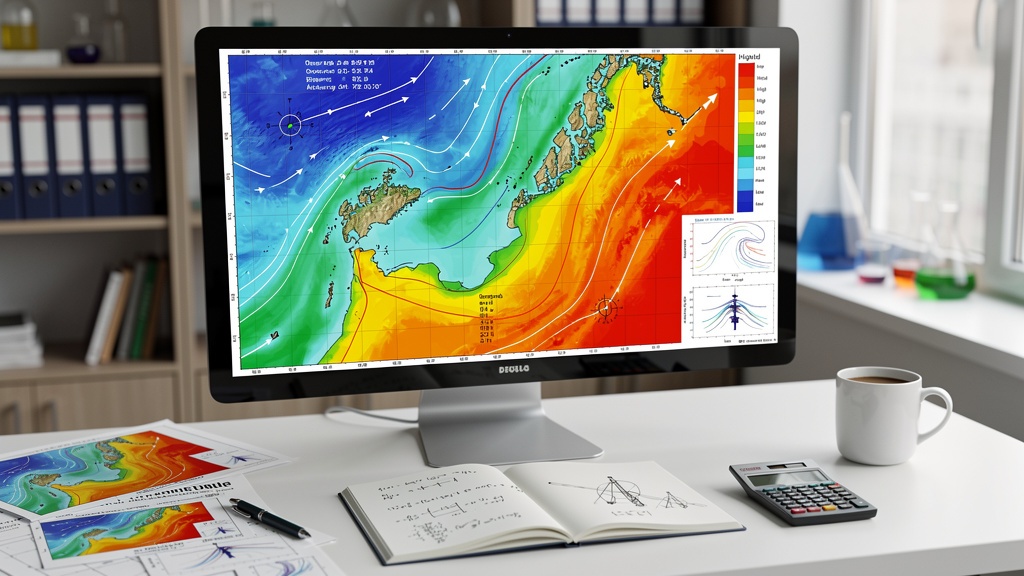
A research desk with a large computer display showing a coloured, layered energy-resource map overlaid on an ocean region.
Reading the atlas — most modern resource displays combine model output with moored and satellite measurements.
Explore by technology

Seven deep-dive pages, one for each form of blue energy

Each page covers the working principle, India-specific resource estimates, device maturity, real projects, costs and challenges. Use these as your starting points for deeper reading.

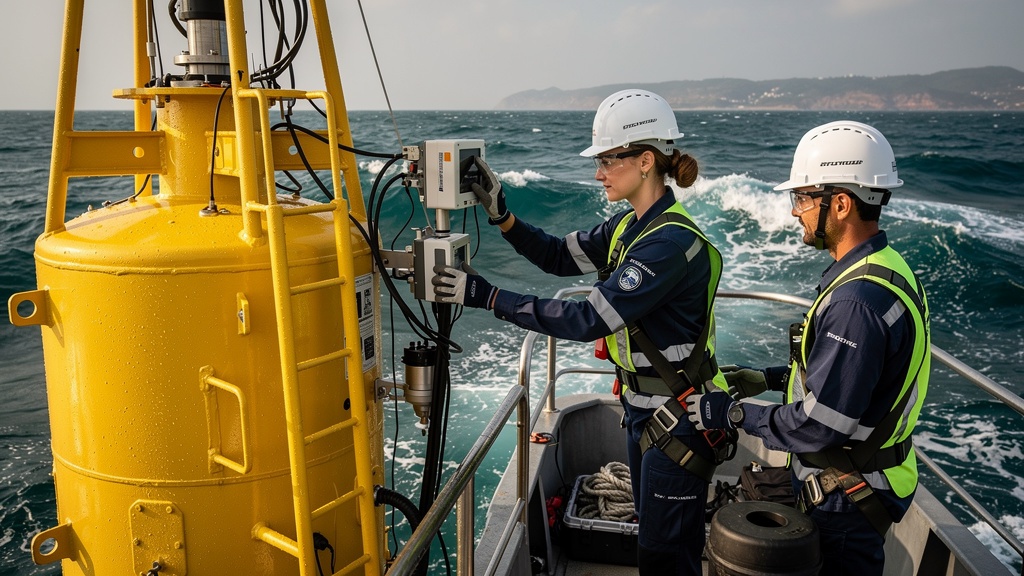
An ocean engineering engineer servicing a wave energy buoy from a small boat in deep blue water.

Wave energy

Ocean surface waves carry density of energy that, on the right coast, can be 5–10× the flux carried by wind alone. India’s south-west coast and parts of the east coast have meaningful wave resource.

Working principleIndia sitesCosts
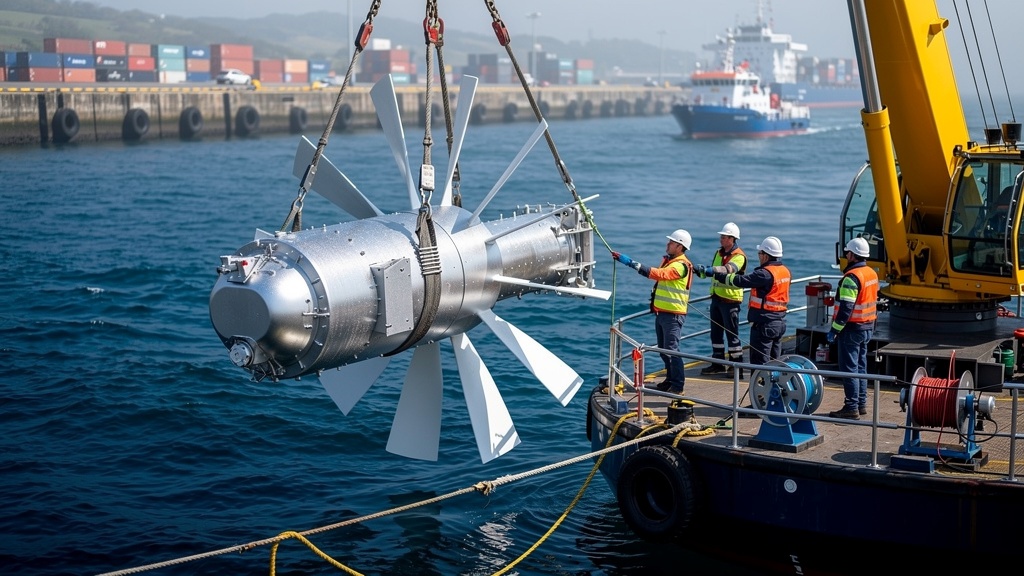
An underwater tidal stream turbine being lowered into the sea from a small crane barge.

Tidal energy

Bounded bays — the Gulf of Khambhat in Gujarat and the Sundarbans in West Bengal — show the country’s strongest tides. They are also some of the most environmentally sensitive ecosystems.

Barrage vs streamKhambhatSundarbans
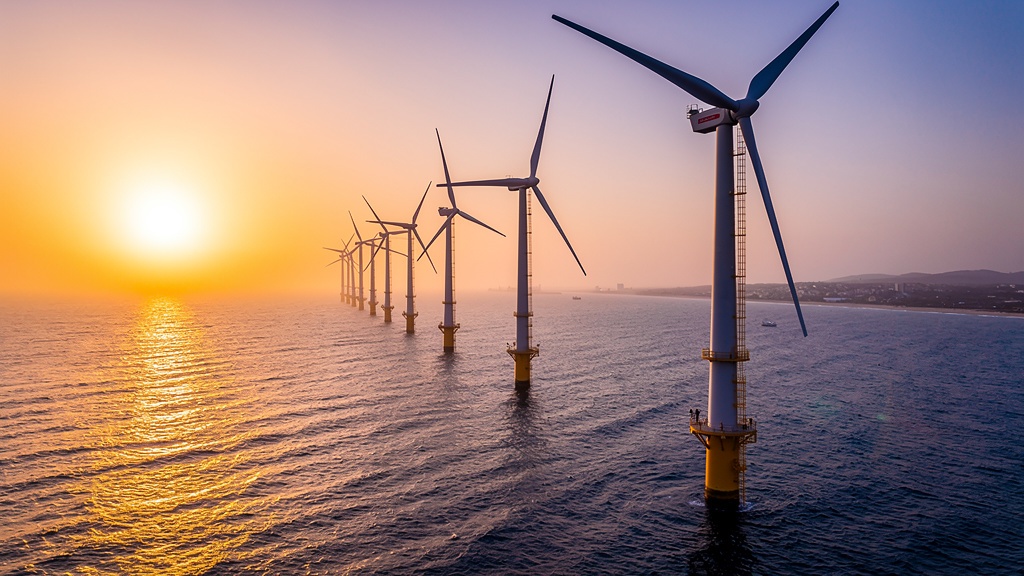
A row of offshore wind turbines standing in the Arabian Sea at sunset off India’s coast.

Offshore wind & floating solar

By far the most mature member of India’s “blue energy” suite. Fixed-bottom offshore wind has policy, lease areas and a national capacity target; floating wind and floating PV are at demonstration stage.

Wind policyFixed vs floatingTamil Nadu / Gujarat
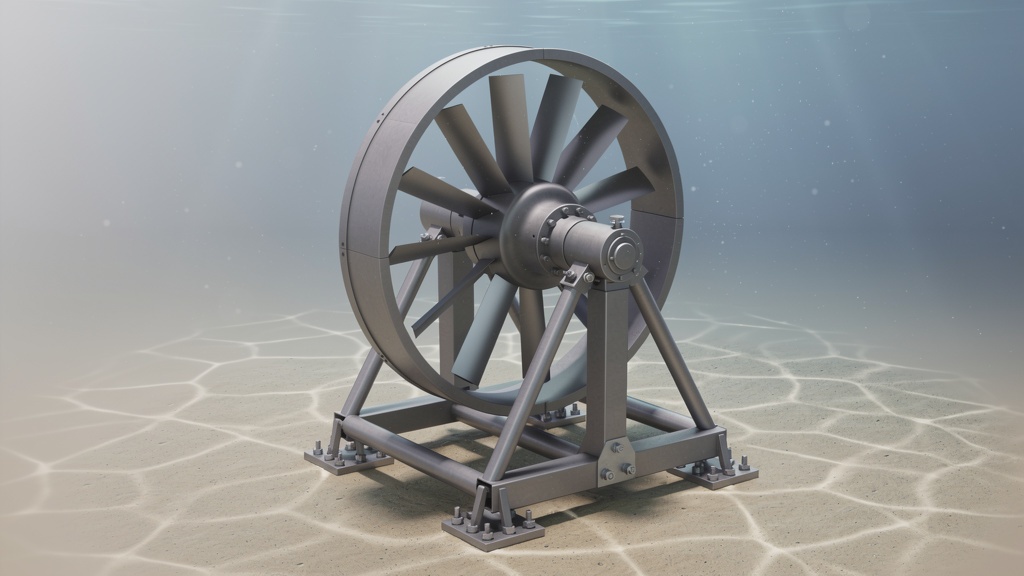
3D rendering of a slow-spinning underwater ocean current turbine mounted on a steel frame.

Ocean currents

Slow, vast, predictable currents like the Indian Ocean’s southwest monsoon current. Power density is lower than tides, but the resource is sustained and more uniform across the year.

Current speedDepth regimeMature global pilots
Important distinctions

Blue energy, blue hydrogen, blue economy, “Blue Energy Motors”…

Same word, four very different meanings. People searching for “blue energy” in India land on entirely different topics depending on the source.

Not the same thing — quick disambiguation
TermFieldOne sentence
Blue energy Marine renewable energy In India: ocean & offshore renewables mapped by INCOIS. The dominant official meaning.
Blue renewable energy Marine renewable energy An interchangeable label for the same broad field — see what is blue energy?.
Blue hydrogen Decarbonised industry / fuels Hydrogen produced from natural gas with carbon capture & storage — a separate low-carbon technology pathway in India’s hydrogen strategy.
Blue economy Sustainable ocean economy Whole-of-government framework covering ports, shipping, fisheries, coastal tourism, marine biotechnology, and ocean energy — see blue economy context.
Blue Energy Motors Vehicle manufacturer An Indian company that produces LNG and electric heavy trucks. Not the topic of this site.

If you arrived at this page searching for blue hydrogen or the truck maker, we’ve linked you to the most authoritative sources — but this site is only to do with ocean and marine renewable energy.

Why this site

Education, data transparency, and realistic pathways

Ocean and marine renewable energy is a popular topic in school projects, media coverage, and builder pitches, but it’s also a topic where a single headline figure can mislead. BlueEnergy.in is built around three commitments.

📚

Education first

Planners, students, journalists and curious citizens come first. Each page starts with the working principle and only then moves on to India-specific resource, projects, costs and trade-offs.

🔍

Transparent sourcing

Every major figure is attributed in-text — INCOIS, NIOT, MoES, MNRE, CEA, peer-reviewed work. Numbers are not cherry-picked to make the field look bigger or smaller than it is.

⚖️

Even-handed

Blue energy is not a silver bullet. We lay out the high capital cost, durability concerns, ecological and fisheries questions, and the realities of intermittency alongside the genuine opportunities.

Frequently asked

Quick answers to the most common questions

Is “blue energy” the same as blue hydrogen?

No. In India’s recent official communications, blue energy refers to ocean and marine renewable energy — wave, tidal, OTEC, ocean currents, salinity-gradient, offshore wind and floating solar, as mapped by INCOIS. Blue hydrogen is fossil-derived (natural gas + carbon capture). They are policy-lightyears apart and are discussed in separate forums.

Why is India’s theoretical blue energy 9.2 lakh TWh when India only uses 1.6 lakh TWh?

The 9.2 lakh TWh figure is the gross energy physically present in the relevant parts of India’s Exclusive Economic Zone before device, cost, transmission, environmental or social constraints are applied. It is the size of the resource, not the size of the deployable or economically retrievable energy. The techno-economic figure is many times smaller — typically well under 10% of the resource figure for most ocean renewables.

Has India deployed any ocean energy at scale?

Offshore wind — yes, at planning and early construction stage with a national target of 30 GW by 2030 and a series of lease areas off Gujarat and Tamil Nadu. Other forms — wave, tidal, OTEC, salinity gradient, ocean currents — are at pilot and demonstration scale. NIOT has operated wave-powered navigational buoys, an early oscillating water column at Vizhinjam, LTTD desalination plants in Lakshadweep, and ongoing OTEC work.

Are these technologies commercially competitive today?

Offshore wind and floating solar are moving down the cost curve most quickly. Wave, tidal, OTEC and salinity-gradient are still at pilot or pre-commercial stage globally; capital costs remain high. Don’t take a deployment figure as proof of cost-competitiveness.

Where can I get the underlying data?

The Integrated Ocean Energy Atlas is published by INCOIS and is reachable from the official INCOIS website. NIOT publishes technical reports and papers on specific technologies. The Ministry of Earth Sciences (MoES) and the Ministry of New and Renewable Energy (MNRE) publish policy and assessment documents. See resources for direct links.